Re: Miscellaneous charts, graphs and maps
Sat August 08, 2020 12:17 pm
elliseamos wrote:That is really poorly done.
I dunno... sounds like the plot of many pre-2000s Bollywood films
Re: Miscellaneous charts, graphs and maps
Sat August 08, 2020 12:37 pm
i just meant the scaling of the chart, not the topic.Bi_3 wrote:elliseamos wrote:That is really poorly done.
I dunno... sounds like the plot of many pre-2000s Bollywood films
Re: Miscellaneous charts, graphs and maps
Sat August 08, 2020 12:42 pm
elliseamos wrote:i just meant the scaling of the chart, not the topic.Bi_3 wrote:elliseamos wrote:That is really poorly done.
I dunno... sounds like the plot of many pre-2000s Bollywood films
So did I
Re: Miscellaneous charts, graphs and maps
Sat August 08, 2020 4:02 pm
What, five feet isn't half the size of five feet two inches?
Re: Miscellaneous charts, graphs and maps
Thu November 12, 2020 9:55 pm
Re: Miscellaneous charts, graphs and maps
Thu February 04, 2021 1:21 am
Hard to believe all this happened in just 6000 years!
Re: Miscellaneous charts, graphs and maps
Fri February 19, 2021 5:15 am
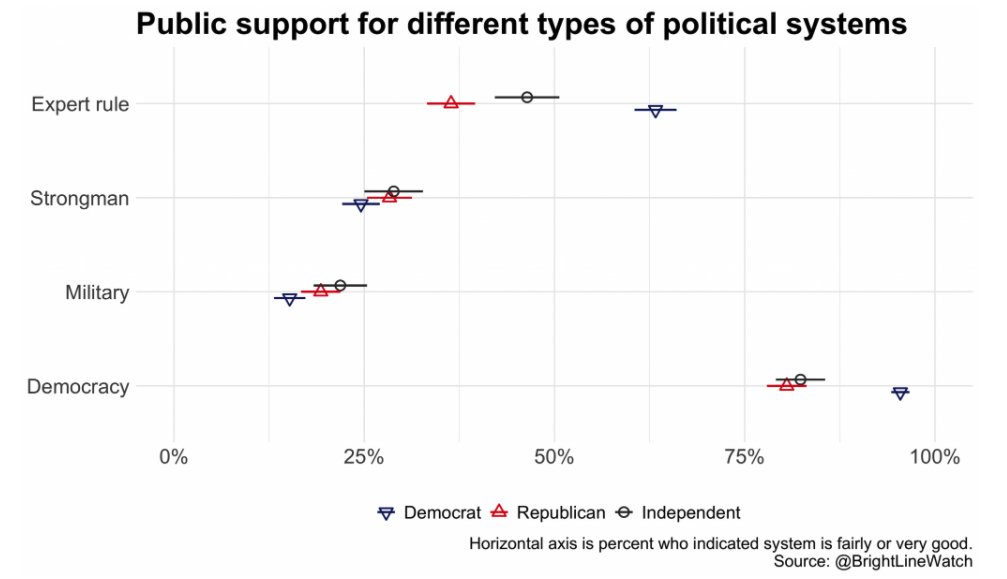
Dr. Fauciocracy when?
Re: Miscellaneous charts, graphs and maps
Fri February 19, 2021 5:31 am
BurtReynolds wrote:Dr. Fauciocracy when?
This is not a good graphic. If your axis title is too long to put on the chart, maybe reconsider your choices.
Re: Miscellaneous charts, graphs and maps
Wed June 30, 2021 4:56 pm

Re: Miscellaneous charts, graphs and maps
Wed June 30, 2021 6:24 pm
i remember seeing a tweet about that several months ago. time is a flat circle.
Re: Miscellaneous charts, graphs and maps
Tue August 24, 2021 3:23 am

Re: Miscellaneous charts, graphs and maps
Tue August 24, 2021 3:30 am
Use a fucking condom, ya freaks!
Re: Miscellaneous charts, graphs and maps
Tue August 24, 2021 11:10 am
Bammer wrote:Use a fucking condom, ya freaks!
They are using those 10% effective condoms Verb recommended.
Re: Miscellaneous charts, graphs and maps
Wed October 27, 2021 2:58 pm
Last night, I had an idea: what would a presidential election look like if it exactly split by the share of people in each state that have a bachelor's degree or higher, with those that have more than the US as a whole went Dem, and those with less went GOP?
Well, here it is:

Apart from a few outliers in the West and Great Plains (KS/partial NE/MT/UT going Dem and NM/NV going to the Republicans), this map otherwise exactly matches 2016.
(Source used,from 2019)
Well, here it is:
Apart from a few outliers in the West and Great Plains (KS/partial NE/MT/UT going Dem and NM/NV going to the Republicans), this map otherwise exactly matches 2016.
(Source used,from 2019)
Re: Miscellaneous charts, graphs and maps
Wed October 27, 2021 3:33 pm
Re: Miscellaneous charts, graphs and maps
Wed October 27, 2021 5:55 pm
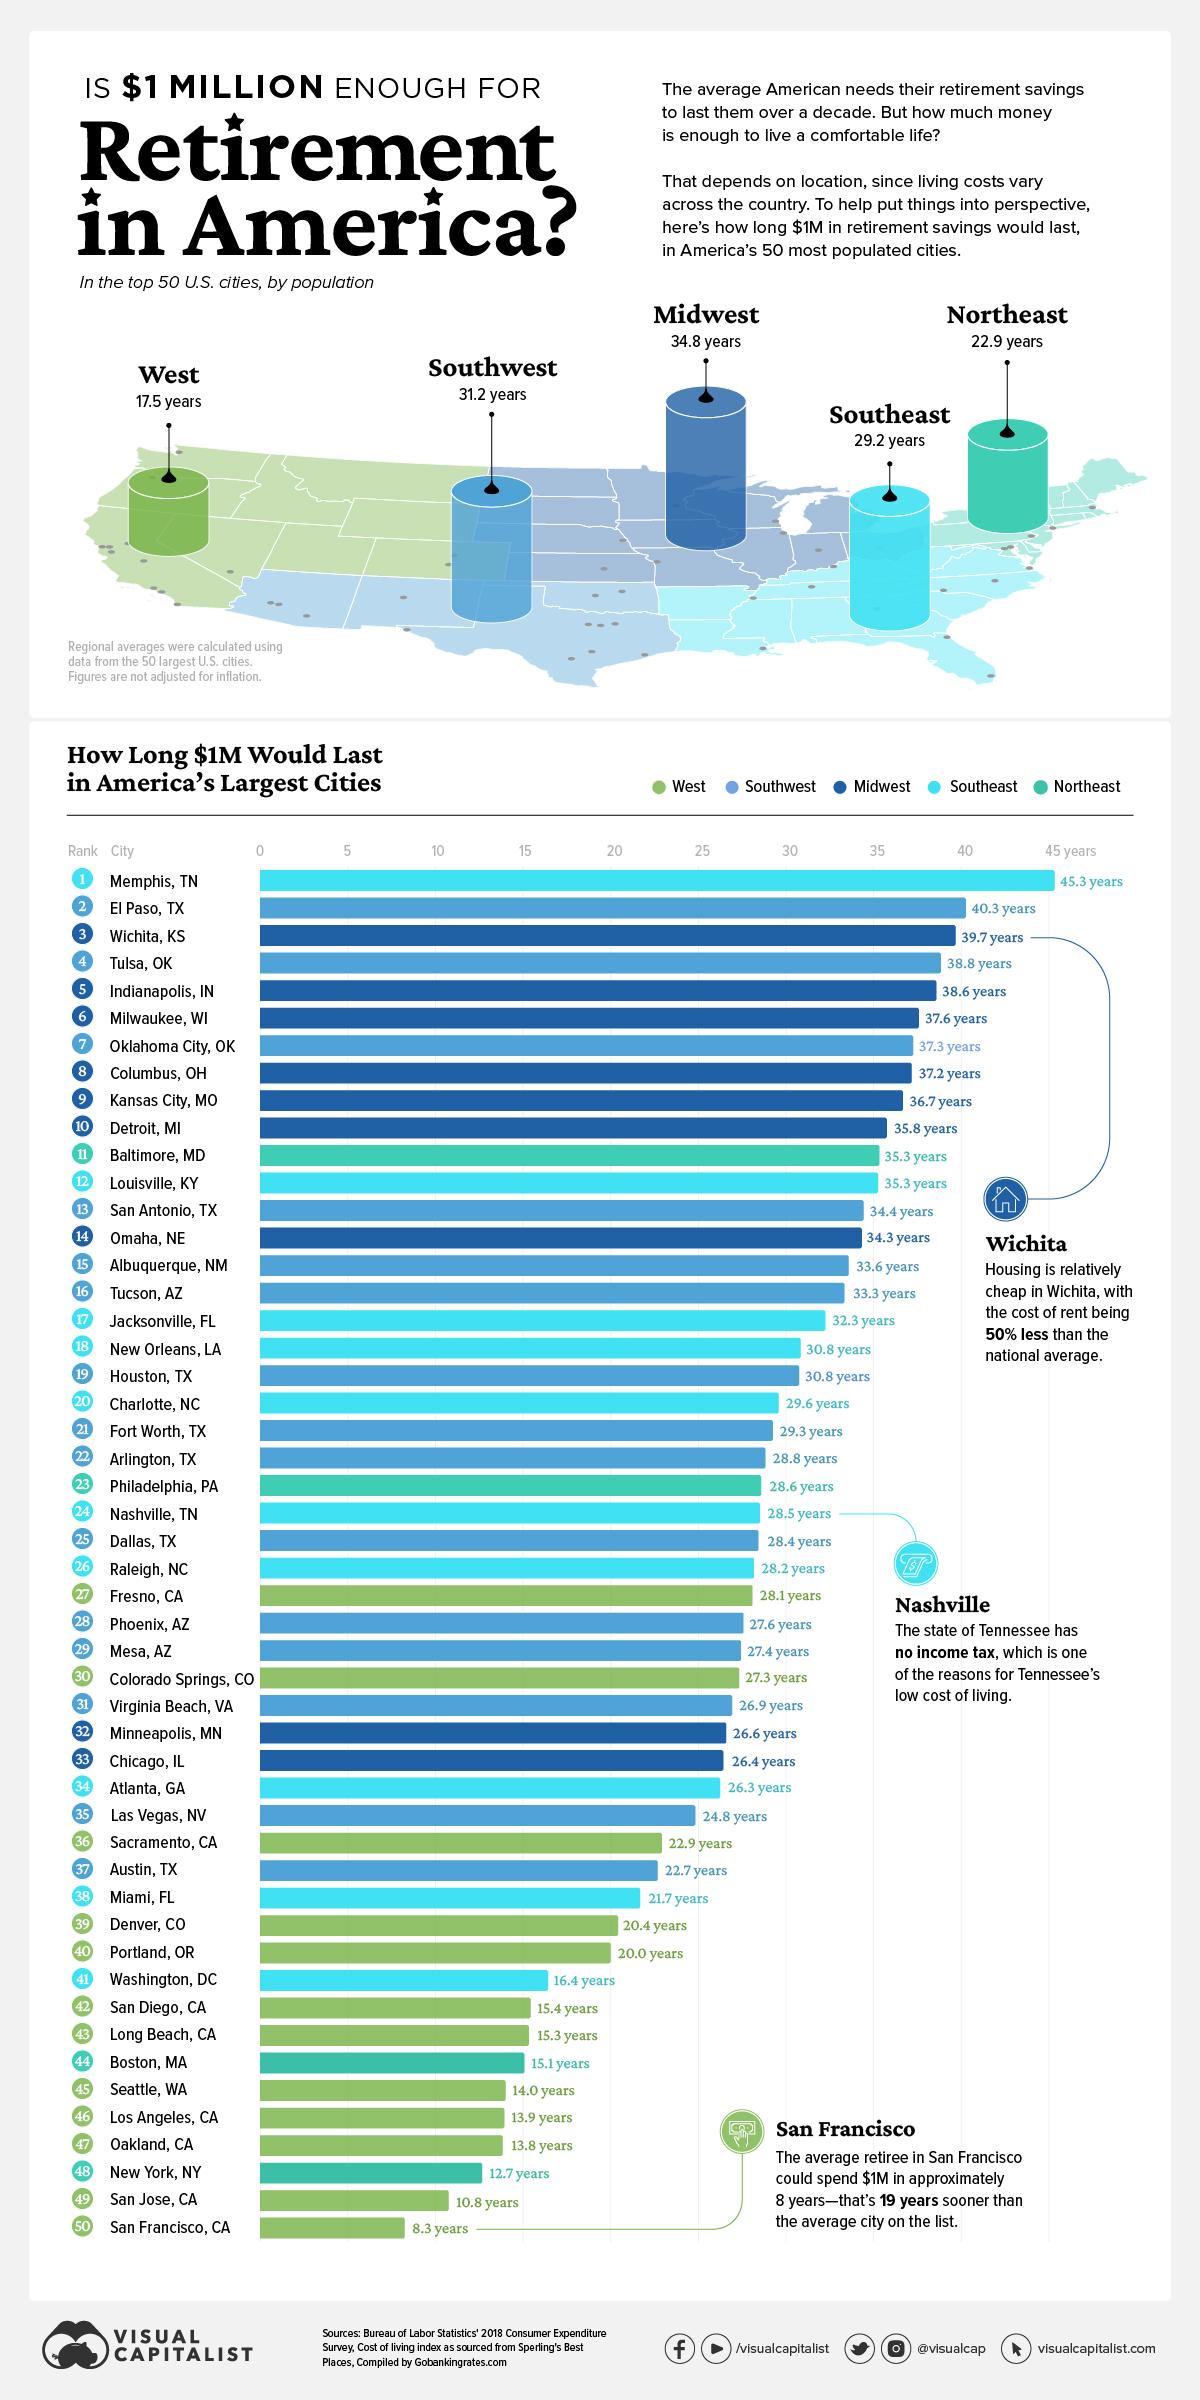
That map is a stark message for the West to get its shit together on liberalizing zoning rules, because people are going to keep moving here (because it's awesome to live over here!), and if you don't let more housing get built, it's going to get less and less affordable.
Re: Miscellaneous charts, graphs and maps
Wed October 27, 2021 7:01 pm

Re: Miscellaneous charts, graphs and maps
Wed October 27, 2021 7:26 pm
Green Habit wrote:That map is a stark message for the West to get its shit together on liberalizing zoning rules, because people are going to keep moving here (because it's awesome to live over here!), and if you don't let more housing get built, it's going to get less and less affordable.
I live in a very dense west coast city in Canada that just keeps getting denser. While the added density marginally makes it more affordable if you want to live in a small condo. However, the densification makes the whole living experience a little less with every new building coming online.
Re: Miscellaneous charts, graphs and maps
Wed October 27, 2021 8:00 pm
surfndestroy wrote:Green Habit wrote:That map is a stark message for the West to get its shit together on liberalizing zoning rules, because people are going to keep moving here (because it's awesome to live over here!), and if you don't let more housing get built, it's going to get less and less affordable.
I live in a very dense west coast city in Canada that just keeps getting denser. While the added density marginally makes it more affordable if you want to live in a small condo. However, the densification makes the whole living experience a little less with every new building coming online.
It's also different as you have "water"
Re: Miscellaneous charts, graphs and maps
Sun November 07, 2021 1:19 pm